This post is the sequel to From Pedagogy to Mathematics, Part 1: Why we can’t get there from here. Below is a very brief summary of that post:
From Pedagogy to Mathematics, part 2: ACCESS & DEMOCRACY
(c) 2021, George Gadanidis, Western University
We have reasons and beliefs for not giving students better access to mathematics. But we need to put these aside not only because they are wrong but also because this enterprise is not about our reasons and beliefs.
This is not about us.
This is about students who spend over 10 years in mathematics classrooms. They deserve access to the structure and beauty of mathematics ideas.
It’s also about democratic ways of being (more to come after the next section).
ACCESS TO MATHEMATICS
What does access to mathematics look like?
Two examples were shared in the prequel to this post:
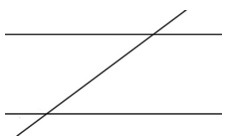
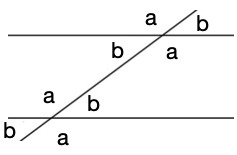
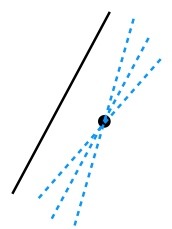
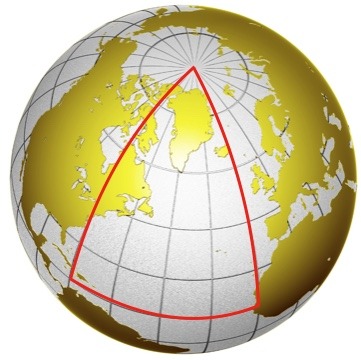
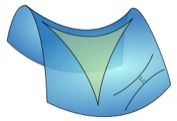
- Moving from “parallel lines never meet” to “assumptions about parallel lines that lead to different geometries”.
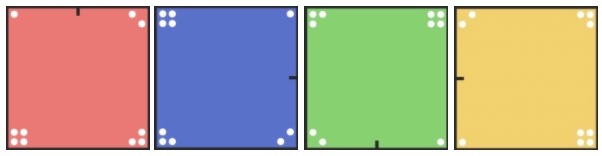
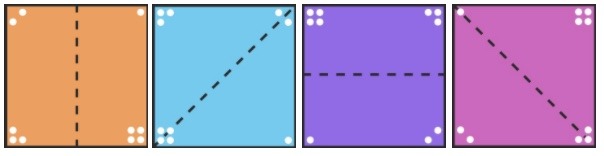
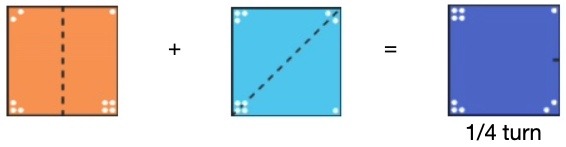
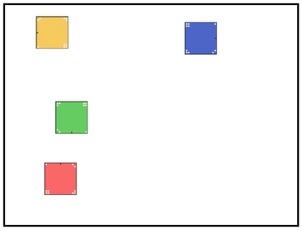
- Moving from “symmetry as an attribute” to “symmetry as a transformation”.
A third example is offered below (adapted from the book Mathematics Grade 9 by George Gadanidis).
EXAMPLE 3: SURFACE AREA & VOLUME
What should we bring to the classroom about surface area (SA) and volume (V) of solids?
A focus on calculation?
- Develop & use formulas for calculating V & SA.
- Calculate V and SA of various solids, including composite solids.
- Find missing dimensions in problems where SA or V is known and some other measurement is missing.
A focus on relationships?
- Investigate relationships between V and SA.
- Learn how to calculate V and SA to collect data about the SA & V of elephants of various sizes.
- Represent the data in various ways (concrete, diagram, table, graph) and look for patterns.
- Tell a story of how SA and V change as dimensions change.
- Tell a story of the meaning of V/SA and SA/V and their graphical representations.
- Tell a story about the meaning of linear and non-linear relationships in the context SA, V and their relationships.
- Tell a mathematical story about elephants’ big ears.
why do elephants have big ears?
[Adapted from Gadanidis, G. (2021). Mathematics Grade 9. Learnx.ca]
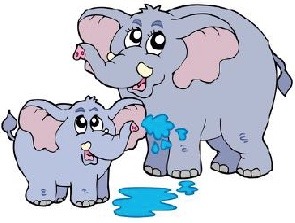
People give all sorts of answers when asked “Why do elephants have big ears?”
- Big ears help elephants hear better.
- They use them to fan themselves, to keep cool.
- They cover their eyes when something scares them.
- Veins bring blood to the ears to be cooled.
Large ears do help elephants keep cool.
- The body (volume) of an elephant generates heat.
- The surface area of an elephant dissipates heat.
- Ears increase surface area without adding much volume.
Do all animals that live in hot climates need big ears? Or, is there something — perhaps something mathematical — that makes elephants different?
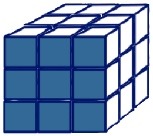
model an elephant AS a cube

Let’s see what patterns we notice when we measure the volume and surface area of elephants of various sizes.
But we have a problem: How do we measure the volume (V) and surface area (SA) of an elephant?

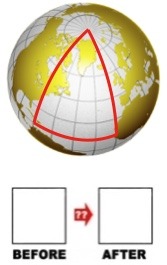
In such cases, mathematicians develop and use models that simplify the problem. For example, instead of measuring V and SA of an elephant, they may measure V and SA of a cube.
So, for the next little while, think of an elephant as a cube.
What geometric solid would you use to model an elephant? Perhaps a rectangular prism, or a cylinder, or a sphere, or … ?
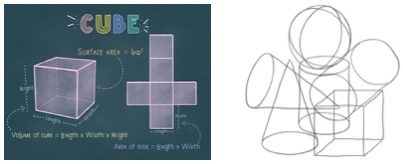
A small elephant:
- The dimensions are 1 x 1 x 1.
- V = 1 cubic unit.
- It has 6 square sides.
- SA = 6 square units.

A bigger elephant:
- The dimensions are 2 x 2 x 2.
- V = 2 × 2 × 2 = 8 cubic units.
- SA = 6 × 4 = 24 square units.
An even bigger elephant:
- The dimensions are 3 × 3 × 3.
- V = 3 × 3 × 3 = 27 cubic units.
- SA = 6 × 3 × 3 = 54 square units.
look for a pattern
Use the table below to record measurements for the first 10 elephants.

- What is the relationship between SA and V?
- Which grows faster: SA or V? Why?
- Notice how the ratios of SA:V and V:SA change.
- What is the meaning of each of these ratios?
- What is the effect on heat dissipation as the elephant (cube) becomes larger?
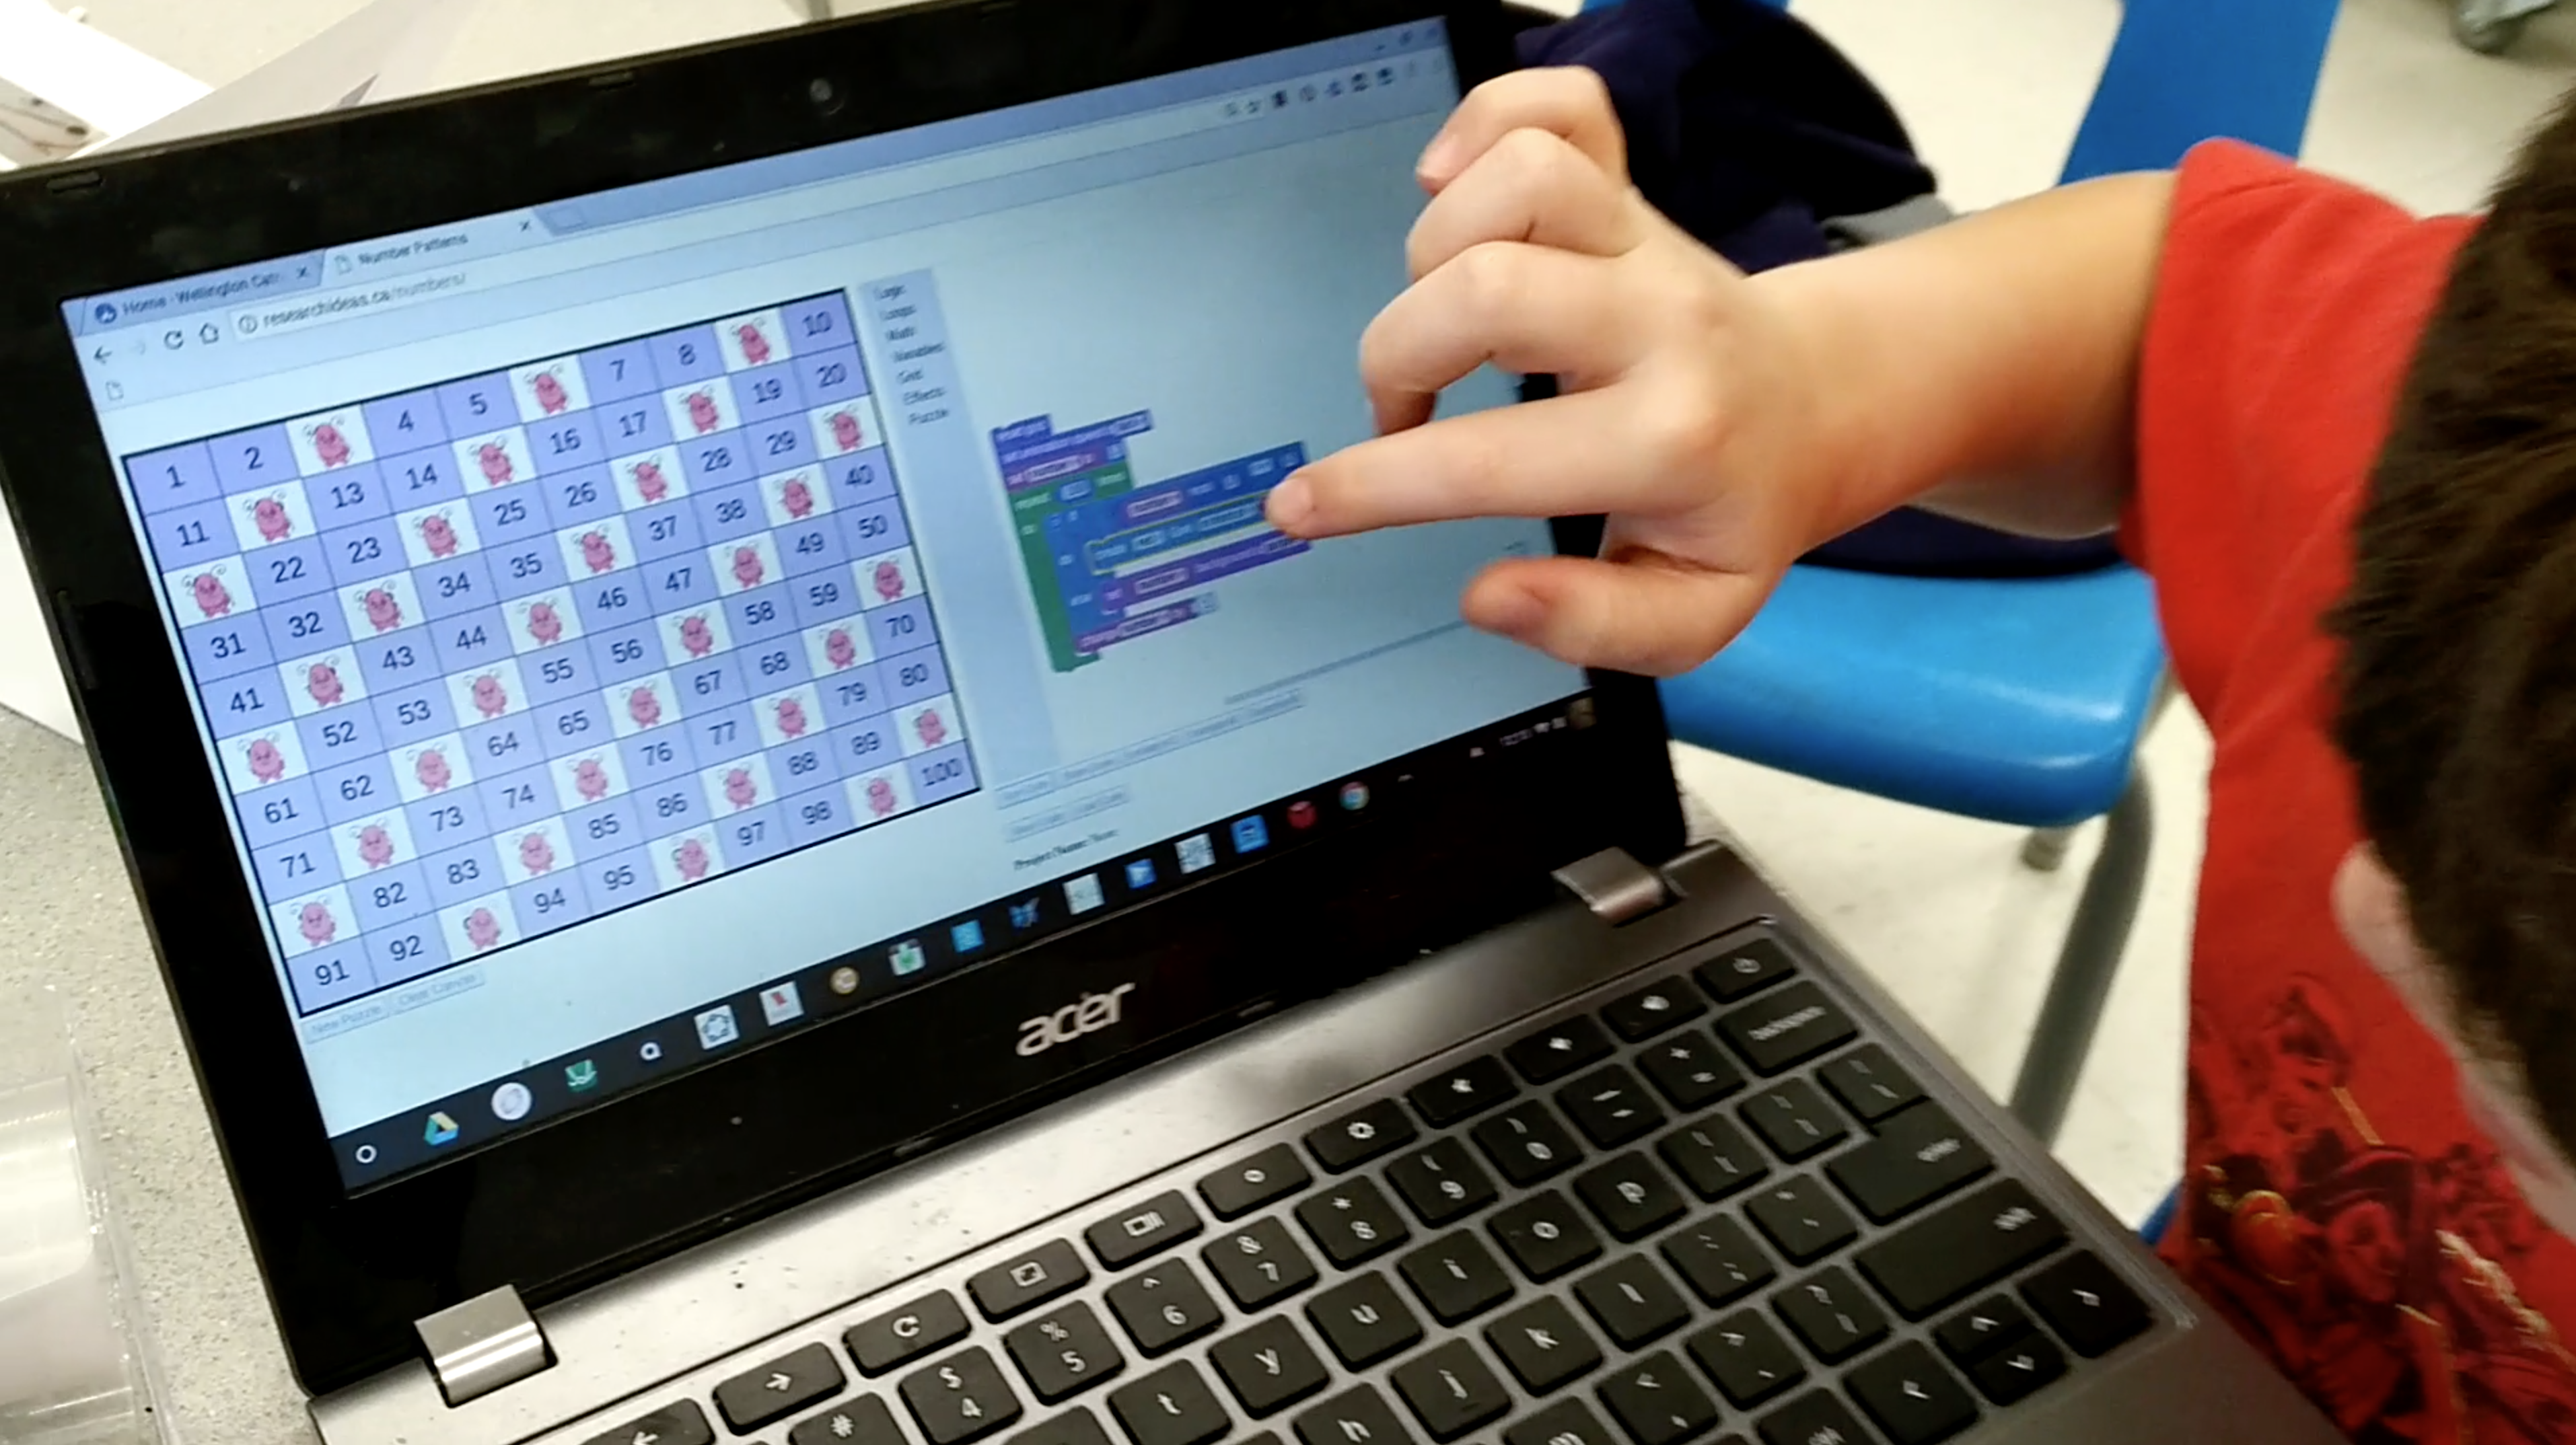
Why do elephants have big ears?
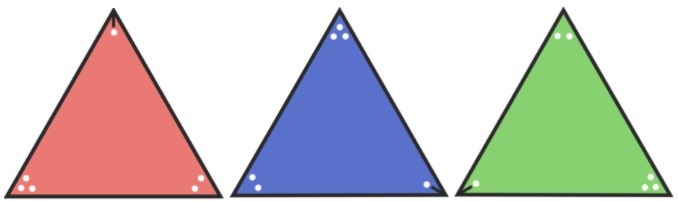
PLOT On a graph
Comparing SA & V
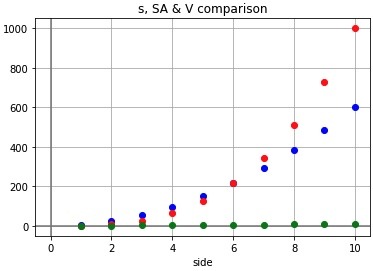
The scatter plots on the right compare the growth patterns of side length, SA and V for cubes for side lengths 1-10.
- Which scatter plot represents SA? Green, red or blue?
- How can you tell?
- What is the intersection point of the red and blue scatter plots?
- What is the meaning of the intersection point?
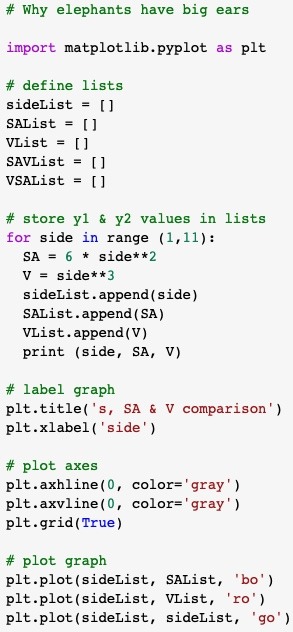
The above graph is produced by the Python code shown on the right.
Go to https://colab.research.google.com/drive/1I_AHVoWqFgWBZU7eEMMgBUK0pkJzlRPx?usp=sharing to view and execute the code.
- Which part of the code calculates SA and V?
- Which part of the code plots the data?
- How are the data stored before they are plotted?
- What part of the code determines the colour of each scatter plot?
Comparing ratios SA : V & V : SA

The scatter plots on the right compare the ratios SA:V & V:SA, for side lengths 1-10.
- Which scatter plot represents V:SA? Red or blue?
- How can you tell?
- Both scatter plots compare SA & V. Why are the shapes of the scatter plots different?
- What is the meaning of each scatter plot in relation to “Why do elephants have big ears?”
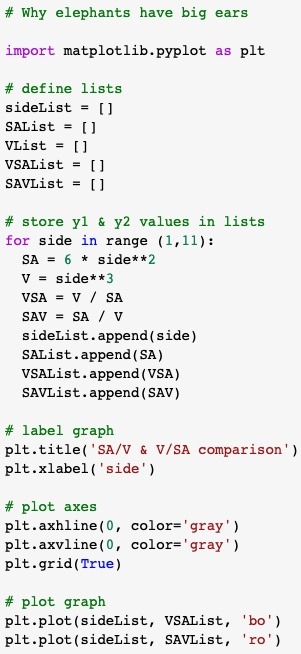
The above graph is produced by the Python code shown on the right.
Go to https://colab.research.google.com/drive/1I_AHVoWqFgWBZU7eEMMgBUK0pkJzlRPx?usp=sharing to view and execute the code.
- Which part of the code calculates the ratios SA:V and V:SA?
- Which part of the code plots the data?
- How are the data stored before they are plotted?
- What part of the code determines the colour or each scatter plot?
CONNECTIONS
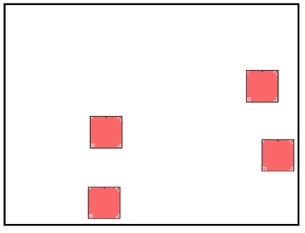
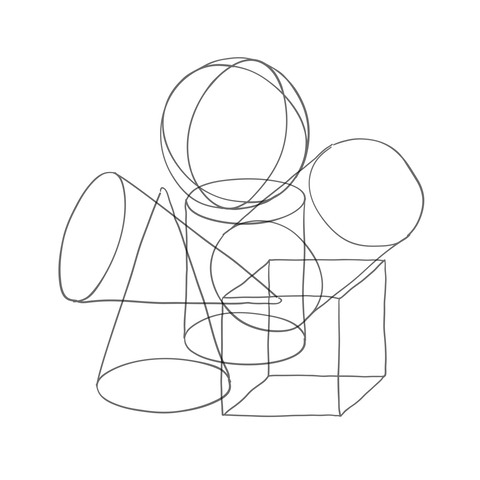
Which will evaporate first?
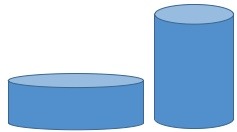
The containers on the right have the same amount of water. Which one will evaporate first? Why?
Most people choose the container on the left. They say that the water surface exposed to the air is greater, so it should evaporate first.
A few people think this is a trick question, and they pick the least obvious answer: the container on the right.
What do you think?
Which will dry first?
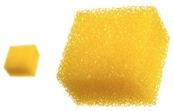
Both sponges on the right are fully soaked with water. Which one will dry first? Why?
Most people pick the small sponge, as it has less water.
Some people pick the larger sponge, since it has a larger surface. The greater the surface area, the faster the evaporation.
A few people think it will be a tie. The larger sponge has more water but also more surface area for evaporation. The smaller sponge has less water but also less surface area for evaporation. The two properties (amount of water and amount of surface area) work against each other and create a balance or a tie.
What do you think?
Puppies in cars

Did you know that it is unsafe to leave a puppy or other small dog in a car on a hot summer day?
Because puppies are small, and their surface area is large compared to their volume, they dehydrate quickly.
When we are hot we perspire. As the perspiration evaporates we feel cool.
This situation is like the two sponges we looked at earlier.
Like the elephants we modelled, the small sponge has a greater SA:V ratio. This is why it dehydrates more quickly.
EDUCATIVE EXPERIENCE & CONTINUITY
Educative experience

Dewey (1938) said that although “all genuine education comes about through experience … not … all experiences are genuinely or equally educative” (p. 25).
Educational experiences offer continuity: they “live fruitfully and creatively in subsequent experiences” (Dewey, 1938, p. 28).
Continuity of experience
Educative experience provides a continuity among past, present and future experience.
There is little continuity between “parallel lines never meet” and mathematics itself. Rather than living fruitfully in further mathematics, “parallel lines never meet” is something to be unlearned in order to make conceptual progress.
Access
The continuity of mathematics experience creates access.
Continuity connects mathematics ideas conceptually, adding depth and understanding and space for wonder.
DEMOCRACY, ACCESS & MATHEMATICS
Democracy is typically associated with the right to vote.
Although the right to vote is very important, we should also consider what other aspects of our society are democratic in nature.
For example, consider the following statement:

Can you imagine a library where the access to books was restricted based on age or perceived ability or a narrow reading of a curriculum document?
Can you imagine a classroom where the mathematics that students experience is restricted?
How democratic are our mathematics classrooms?

ACCESS -- A personal anecdote

I arrived in Canada in grade 6 and my family settled near Danforth Avenue in Toronto. I came across the Pape Avenue Library early on. I was thrilled when I discovered that I could borrow any books that interested me.
Canada was so amazing!

The librarian gave me a temporary library card and off I went to the stacks. I came back to her desk with a pile of wonderful books. I was devastated when she told me that I couldn't take that many on a temporary library card. She consoled me that soon I would be able to.
I read and read and read.

In the summer after grade 8, I came across a book called College Algebra. Its content seemed intriguing. The librarian looked at the book, she looked at me, and then smiled.
I lost myself in mathematics that summer.

Sitting at my desk in grade 9 I wondered, "Why is the teacher holding back? Why is he not sharing the interesting mathematics connections I see?"
School mathematics seemed so shallow.
DESIGN PRINCIPLES
The following is a draft of design principles I will use to engage teacher candidates in learning how to create educative / accessible / democratic mathematics classroom experiences, in a course I am teaching this year.
1. Pick a mathematics topic
Pick a mathematics topic from the curriculum.

- Start with a broad topic, like a strand: number, algebra, measurement, probability, and so on.
- Research that topic, with an eye on the subtopics from your curriculum.
- Look for ideas that capture your imagination and offer a sense of wonder.
- Pick the most interesting idea as your focus.
2. Understand its conceptual structure
Research in depth the conceptual structure of your mathematics idea of interest.
- What is its historical development?
- What other concepts are connected? How?
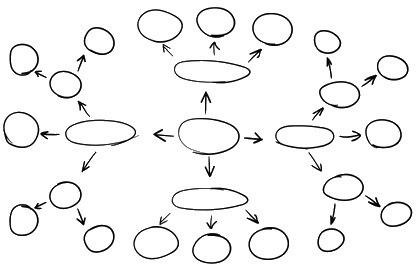
- Draw a concept map to show mathematics landmarks and how they connect.
3. Script a story

Script the most interesting mathematics you learned as a story — as a sequence of experiences.
- The core ideas in good stories are expressed in ways to be accessible to a wide audience (low floor).
- The story sequence offers conceptual surprise.
- Surprise leads to opportunities to think, wonder and gain deep conceptual insight (high ceiling).
IS IT PEDAGOGY OR IS IT MATHEMATICS?
Is the design process outlined above pedagogy or is it mathematics?

It is definitely mathematics.
It is about understanding the conceptual structure of mathematics ideas in ways that may be communicated to others who are not experts in the field.
If we can’t tell a story that offers conceptual surprise and insight about what we know — if we can’t communicate a sense of wonder to a broad audience — then we don’t understand deeply enough.
MORE?
Three examples have been shared in these 2 posts:
- on parallel lines
- on symmetry
- on surface area and volume
You can see more examples in videos 4-15 at https://imaginethis.ca/videos.
Start by trying one that best relates to your curriculum.
But don’t stop there:
- Use / adapt the above design principles to create your own math stories.
- Engage students in also researching / creating such math stories.

________________
References
Dewey, J. (1938). Experience and education. New York, NY: Collier Books.