In my view, the Grades 1-9 Ontario mathematics curricula are the strongest I’ve seen anywhere. The most significant—most wonderful—innovation is the integration of coding (computer programming) and mathematics, across grades 1-9.
EQAO assessments serve as models for educators and education leaders of what should be taught in classrooms. How do Grade 9 EQAO assessments model the integration of mathematics and coding, and how may they be improved?
The problem
This is the core mathematics + coding expectation for Grade 9 in the Ontario curriculum:
C2. Apply coding skills to represent mathematical concepts and relationships dynamically, and to solve problems, in algebra and across other strands.
Notice that the curriculum puts a focus on:
- coding,
- concepts and relationships, and
- dynamic representation.
Let’s take a close look at an EQAO question.
Grade 9 EQAO question
Shown below is a 2025 Grade 9 EQAO question (from https://www.eqao.com/math-resource-released-questions-g9-25).
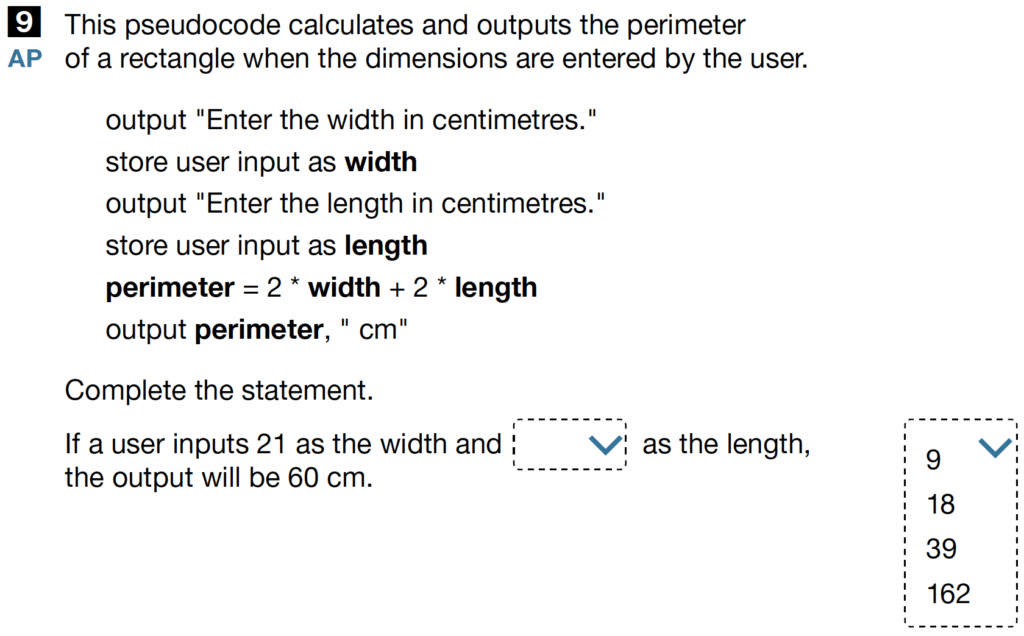
This question relies on pseudocode (pseudo means fake).
The pseudocode uses the formula for the perimeter of a rectangle,
P = 2 × width + 2 × length,
and determines the perimeter for length and width values entered by the user.
If we translated the pseudocode into actual, runnable code, executing it would simply produce a single numerical output. There would be no dynamic representation, no visualization of changing quantities, and no modelling of relationships—the very elements the curriculum emphasizes.
It is not clear why students in Grade 9 would need to write code to do a simple calculation related to the perimeter formula for a rectangle.
In Grade 5
The EQAO question posed to students along with this pseudocode is: determine the length when the width is 21 cm and the perimeter is 60 cm.
Using the perimeter formula for rectangles is a Grade 5 expectation. In fact, by Grade 5 students are already expected to go further conceptually—for example, understanding that shapes with the same area may have different perimeters, and solving related problems. This represents deeper mathematical thinking than simply substituting numbers into a perimeter formula.
In Grade 9
Below is the Grade 9 expectation related to area and perimeter, as well as surface area and volume.
E1.4 show how changing one or more dimensions of a two-dimensional shape and a three-dimensional object affects perimeter/circumference, area, surface area, and volume, using technology when appropriate
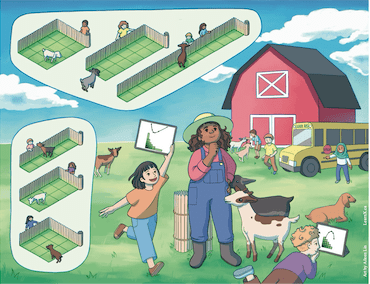
The focus 0f this expectation is on changing dimensions and noticing effects. This can be modelled algebraically and graphically, as well as with code, to investigate patterns and solve optimization problems, such as finding the greatest area for a given perimeter or the shortest perimeter for a given area, as illustrated below.
For surface area and volume relationships, students may investigate how surface area and volume grow at different rates and real life implications. For example, surface area and volume relationships help explain how elephants’ big ears increase surface area (with minimal increase in volume) and help dissipate heat from their large bodies; and why our bones’ reliance on cross-sectional area for strength limits how much volume/mass they can support.

This type of modelling is an expectation in Grade 9.
D2. apply the process of mathematical modelling, using data and mathematical concepts from other strands, to represent, analyse, make predictions, and provide insight into real-life situations
In short, the EQAO question shared above does not reflect the mathematical sophistication necessary in Grade 9, and it misses the curriculum’s focus on genuine coding and dynamic representation, and on modelling.
Let’s take a look at how we may design two better questions.
BETTER question #1
Context
Question 1 below focuses on linear equations like y = mx+ b, and the effect of slope (m) on their graphs.
- This is grade 9 level content.
- Additionally, the question uses Scratch, which:
- provides dynamic output, and
- models for educators how they may use real code in their classroom.
Question 1
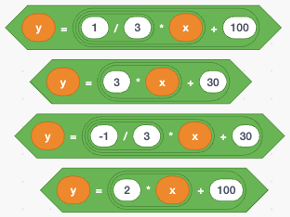
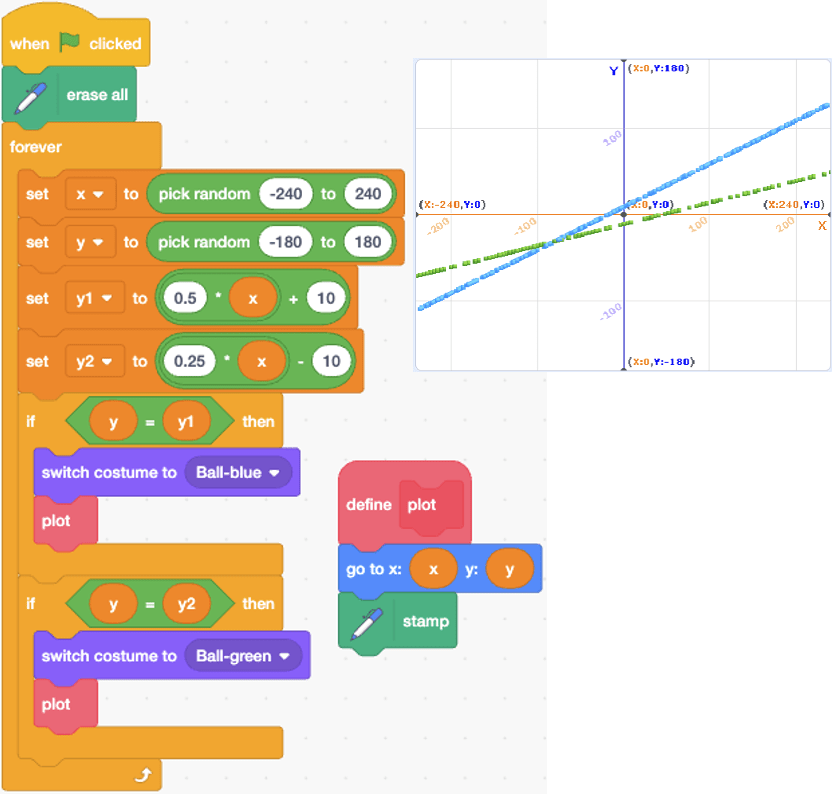
Shown below is a Scratch program and its output.
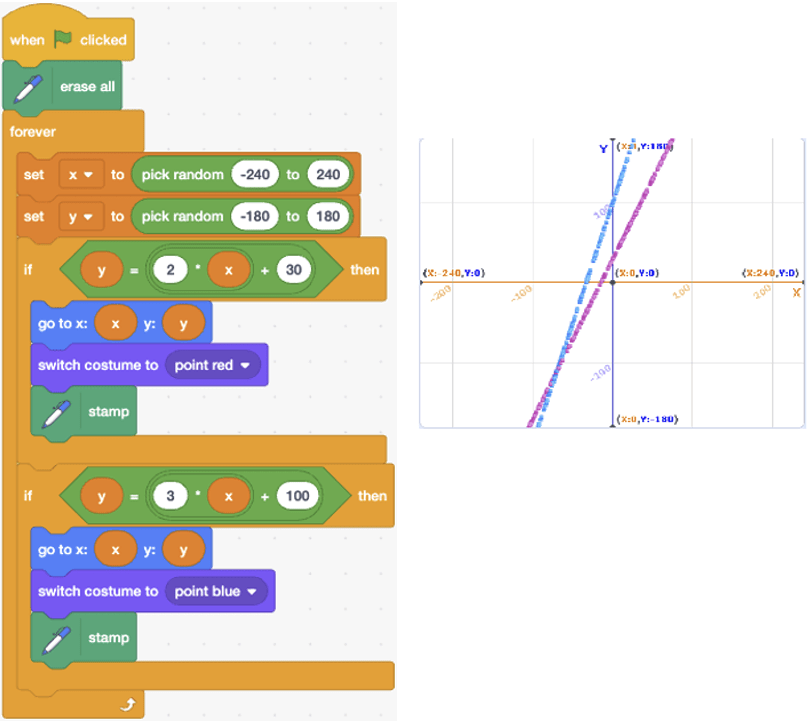
Which of the 4 edits to the equation of the blue graph would make the two lines:
- parallel?
- perpendicular?
Question 1 in the classroom
This code is available at https://scratch.mit.edu/projects/1079745973/editor
Students are given the link to the code and work in pairs.
- They alter the slopes and y-intercepts and observe how the graphs change.
- They solve puzzles to alter the code so that the two graphs:
- are parallel
- are parallel and horizontal
- are parallel and vertical
- cross the y-axis at the same point
- cross the x-axis at the same point
- are perpendicular to one another
- look different in some other interesting way
- Students share and discuss as a whole class
Notice
We give students existing code that works, along with puzzles that require them to modify it.
Code—like a bicycle, and unlike pseudocode—is alive. It is best learned through use, incidentally, through exploration, through meaningful mathematical activity.

This is coding as intended by the curriculum: dynamic, conceptual, mathematical.
BETTER question #2
Context
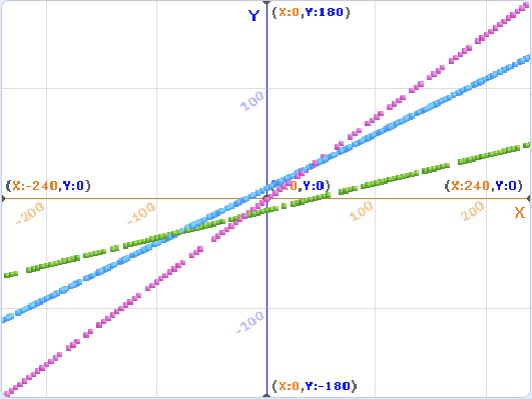
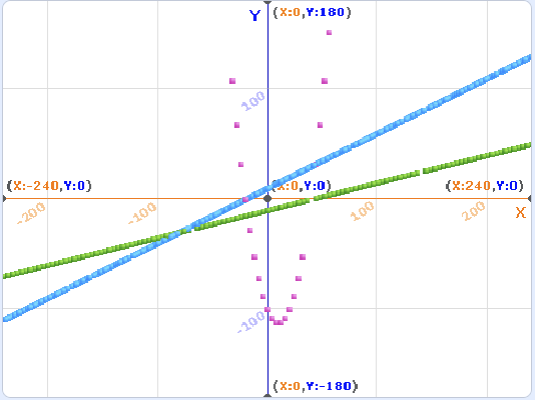
Question 2 below focuses on the graphs of two linear equations, y1 = 0.5x + 10 and y2 = 0.25x – 10, and the effect of adding their y-values to get a new equation y3.
y3 = y1 + y2 = (0.5x + 10) + (0.25x -10) = 0.75x
The pink plot shown below represents y3.

Question 2
Shown below is a Scratch program which plots two linear relations, y1 and y2.
Imagine that a new conditional block is added (shown below) to also plot the graph of y1 + y2.
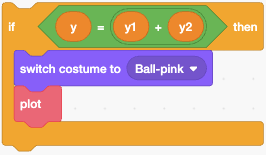
- What would be the slope of the new graph?
- What would be its y-intercept?
Question 2 in the classroom
This code is available at https://scratch.mit.edu/projects/1278149482/editor
The activity may be extended to subtraction as well as multiplication of y-values (which creates a quadratic function).
Addition / subtraction
y3 = y1 + y2 = (0.5x + 10) + (0.25x -10) = 0.75x
Students are given the link to this code and work in pairs.
- They run the code and see what it does.
- They predict the output when the conditional block for plotting y1 + y2 is added to the code.
- They add the new conditional block (available at the above link) and run the code to text their prediction.
- They solve puzzles in pairs …
- Predict the equation and the graph for y3 = y1 – y2
- [solution: y3 = y1 – y2 = (0.5x + 10) – (0.25x -10) = 0.25x + 20]
- How is the slope of y3 related to the slopes of y1 and y2?
- How is the y-intercept of y3 related to the y-intercepts of y1 and y2?
Pink plot shows y3.
Multiplication
- Students work in pairs to predict the equation and the graph for y3 = y1 * y2
- [solution: y3 = y1 * y2 = (0.5x + 10) (0.25x -10); y3 graph shown in pink below]
- They alter and run the code to test their prediction.
- They solve more puzzles:
- Where does y3 cross the x-axis? Why?
- How do the x-intercepts of y3 relate to the binomial factors (0.5x + 10) and (0.25x -10)? Why?
- Students share and discuss as a whole class
Understanding mathematics and coding
Need more ideas on this theme? See https://imaginethis.ca/u
Need help implementing mathematics + coding? I am happy to offer online meetings/sessions with lead teachers and curriculum designers. See my contact info at https://imaginethis.ca/about